
Road infrastructure · local authorities
Automatic detection of pavement defects
We drive the street with our 360° panoramic capture system, analyse the images for possible pavement defects, and every finding is checked before it reaches the final inventory.
At the end, the client receives the position of the defects, supporting images, a map and GIS data that can be used for further checks and for planning maintenance works.
From the field to the verified inventory
360° panoramic capture
Our vehicle drives the street in normal traffic, with no need to close the road.
The cameras capture the pavement and its surroundings in sequence, and the images are georeferenced along the route.
This also keeps a record of what the street looked like at the time of capture.
Automatic detection
The software analyses the images and flags possible:
- potholes;
- longitudinal cracks;
- transverse cracks;
- alligator cracking.
Findings from successive images are correlated so that the same defect is not counted more than once.
The automatic result is not delivered directly to the client.
Specialist check
Every finding is checked on the original image.
We confirm the defect, correct its type where needed, or remove the finding when the image shows something else.
Shadows, patches, manhole covers and other elements that can be mistaken for a defect do not enter the final inventory unless they are a pavement problem.
Map and chainage
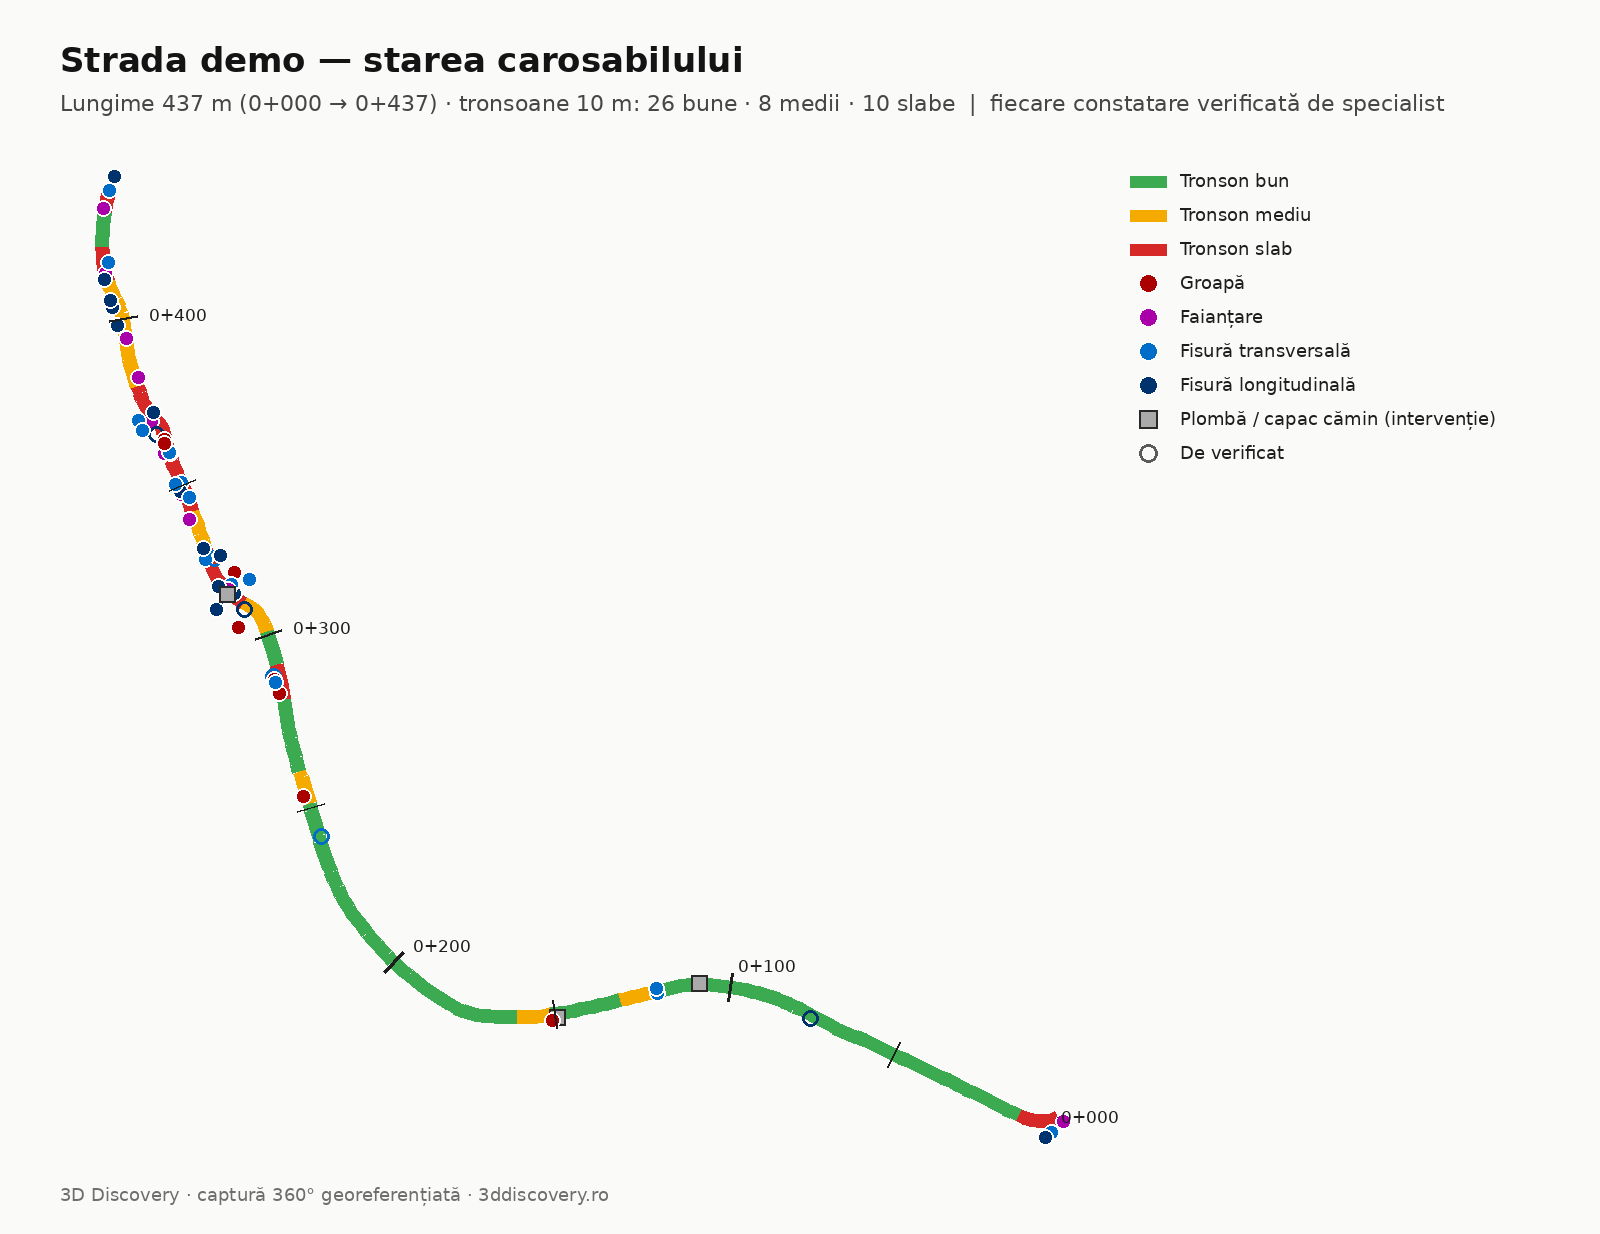
The street is divided into 10-metre segments.
For each segment, the number and type of confirmed defects can be followed.
Every defect is positioned along the route, for example km 0+215, and comes with the identified type and the image on which it was confirmed.
This way the client can quickly see where problems are concentrated and return to each position later.
Example: Iazului Street, Râșnov
We applied the whole workflow on Iazului Street in Râșnov, an urban asphalt street with patches from utility works and manholes.
The final inventory contains:
- 16 transverse cracks;
- 14 longitudinal cracks;
- 11 areas of alligator cracking;
- 8 potholes.
Findings caused by shadows, patches, manhole covers or other elements that were not defects were removed at the review stage.
The Râșnov example shows how we work and the form in which the inventory can be delivered. It is not an independent test of the system’s performance.
See the data, not just the map
You can download the sample inventory in CSV format.
For each defect, information such as the following is available:
- chainage;
- side of the road;
- distance from the centreline;
- defect type;
- review status;
- coordinates.
What you get
Depending on the project, the delivery can include:
- a map of the identified defects;
- the street divided into 10 m segments;
- the list of confirmed defects;
- the position of each defect along the route;
- coordinates;
- supporting images;
- the length of the streets analysed;
- a site plan with the defects marked;
- GIS files for integration into your system;
- 360° panoramic imagery of the route, viewable online.
The data can be organised in whatever inventory structure the client needs.
For municipalities and road authorities
The inventory shows where defects are concentrated, without relying only on complaints or on a visual check from memory.
It can be used as a basis for site checks and for preparing maintenance programmes.
Instead of just a list of streets, every problem stays linked to its position and its image.
For planning and utility works
Before work on a network, the condition of the existing pavement can be documented.
Once the works are finished, the same area can be captured again and compared with the previous situation.
This leaves a visual reference of the street before and after the intervention.
Documenting condition before and after works
The 360° capture keeps an image of the pavement as it was on the day we surveyed it.
If the area is captured again later, the two moments can be compared.
This can be useful when an intervention or utility work has to be followed up, or simply to see how a street has changed over time.
Good to know
We detect what is visible
The analysis is done on images of the pavement.
We can identify the type and position of a visible defect, but we do not determine the depth of a pothole from these images.
Every finding is checked
The software helps find the areas that need to be analysed.
The final inventory is produced after the findings have been checked.
Positioning is in the order of 1–2 metres
With panoramic capture, the position of defects is in the order of 1–2 m.
This is enough to find the area again on site and for a visual inventory.
If the project requires survey-grade accuracy, we add LiDAR and topographic measurements to the capture.
Site conditions matter
Capture is done on a dry road with good visibility.
Water, snow, strong shadows, vegetation or parked vehicles can hide parts of the pavement.
It can be repeated
If the same street is captured again later in comparable conditions, the inventories can be placed side by side to see what changed between the two campaigns.
One pass can document more than the pavement
The panoramic images also keep the context of the whole street.
Depending on the project, the same field campaign can be used to inventory other visible elements: signs, poles, infrastructure elements or other objects requested by the client.
This information can be organised separately in GIS and viewed together with the route imagery.
Send us your street list
If you have a road, a neighbourhood or a street network to check, send us the area and its approximate length.
We look at the route and tell you what can be documented, which type of capture makes sense and what the final delivery can look like.