
One field campaign. Data you can keep using.
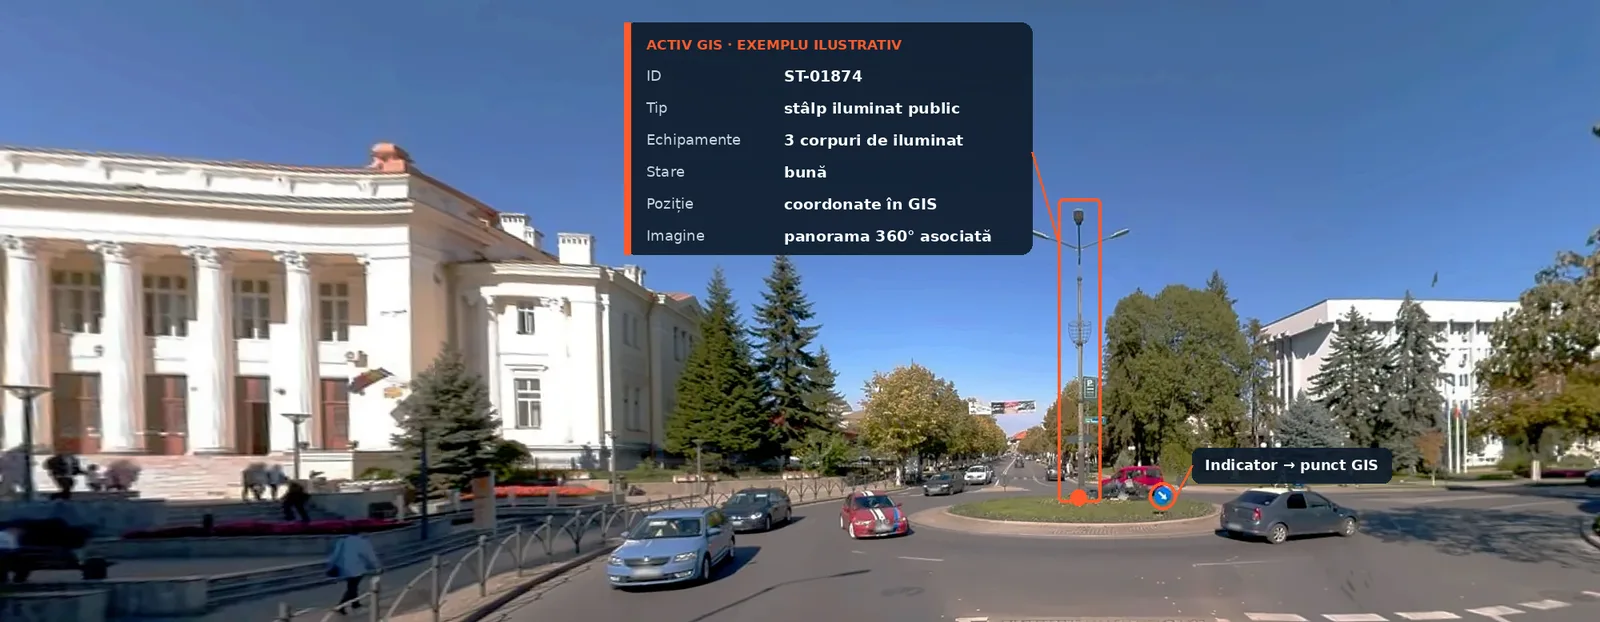
From image to inventory: the pole is identified in the 360° panorama and linked to its position on the map.
A sign, a pole, a manhole or a tree can end up in several documents, produced at different times by different teams. We try to simplify the fieldwork.
We drive the route, capture the existing situation and build the GIS inventory the client needs. Objects can be linked to the 360° images in which they appear, so after the campaign you can go back along the route from the office.
Who it is for
Depending on the project and the tender specifications, the inventory can include:
There is no universal inventory. Before fieldwork we agree what must be identified and which information must be filled in for each object.
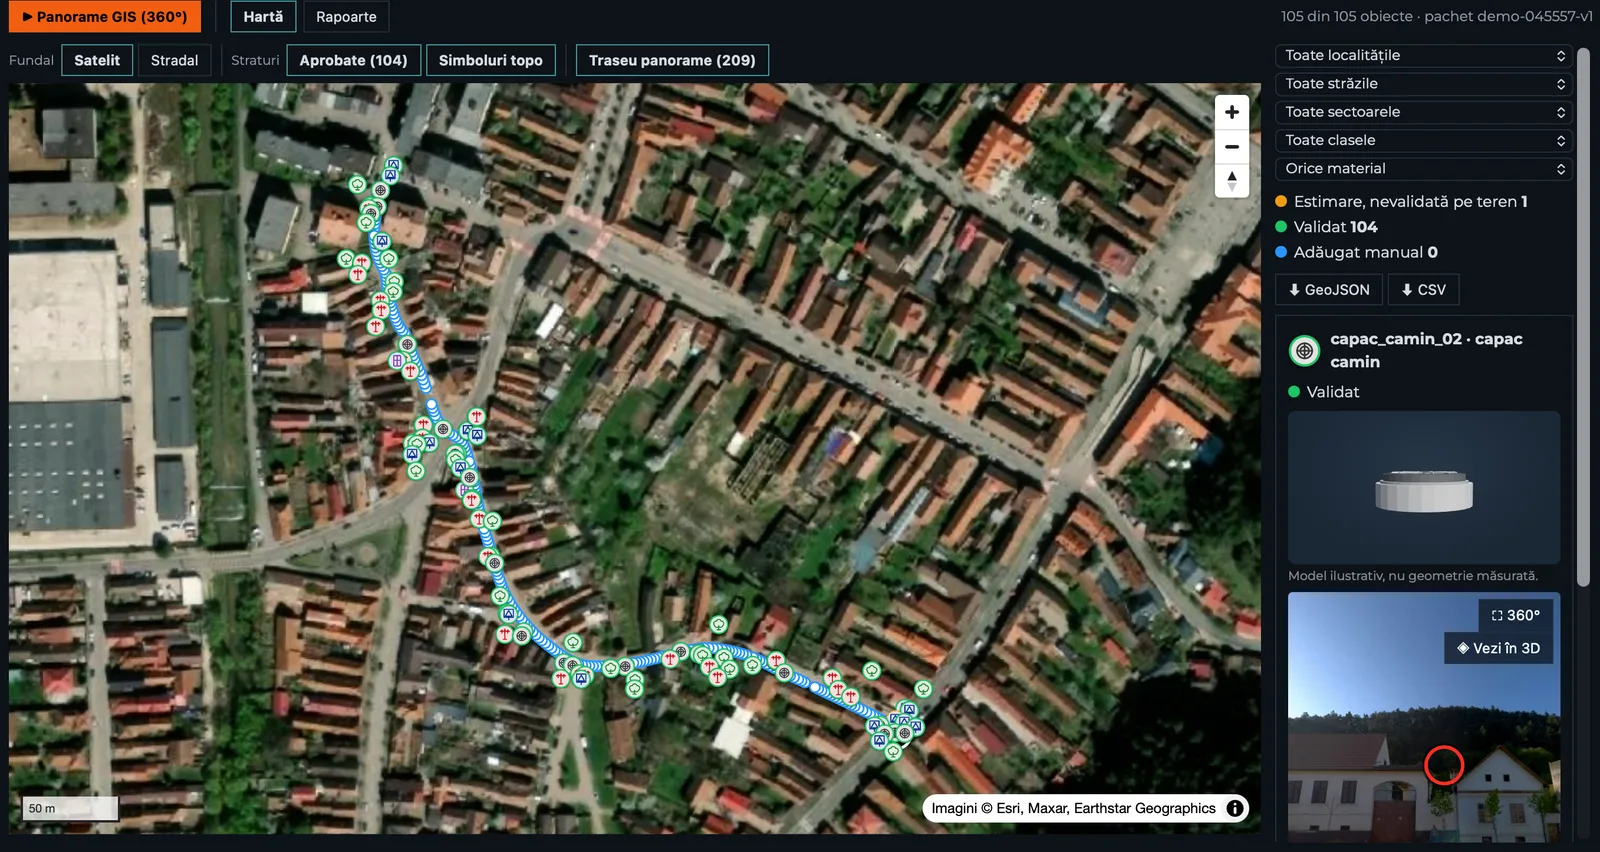
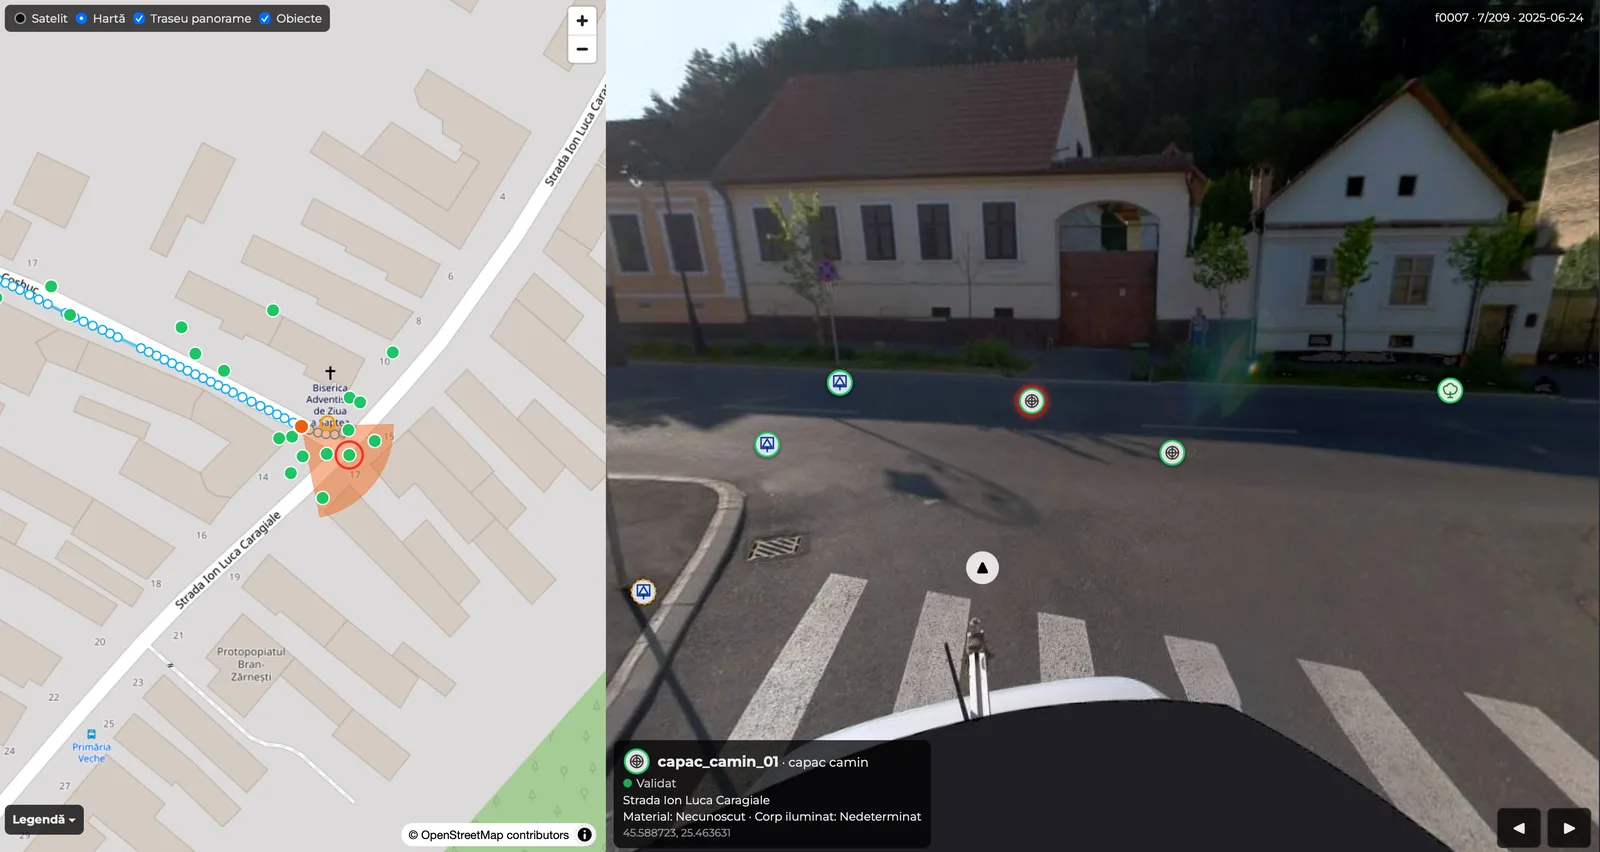
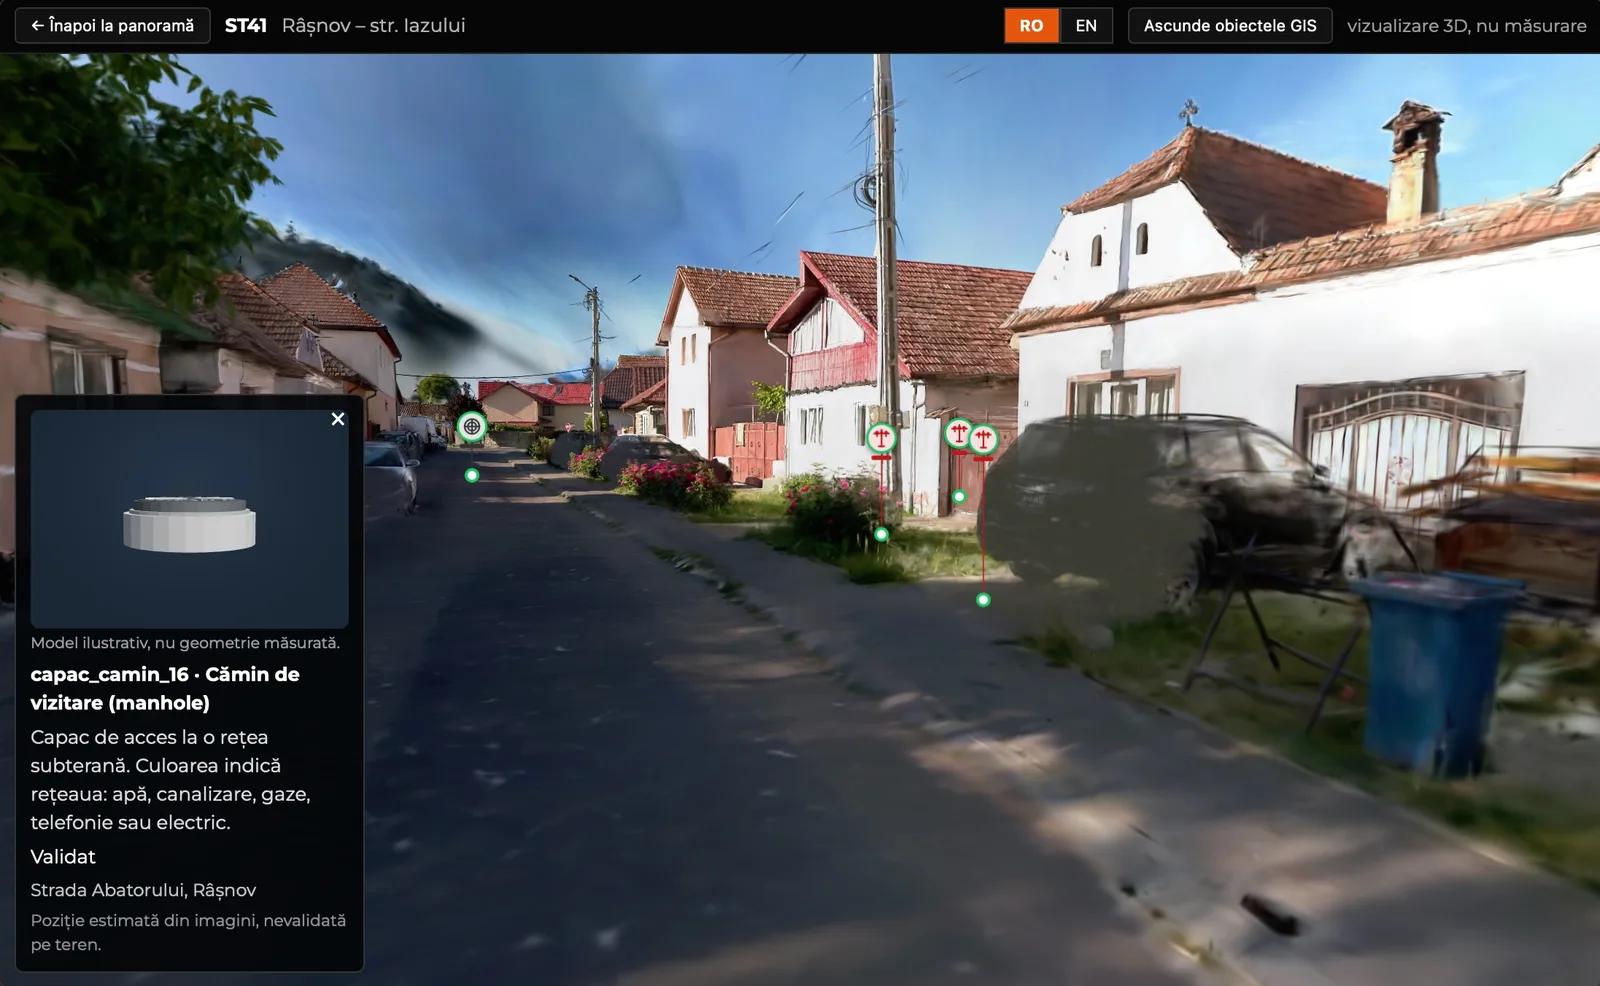
For us, a GIS inventory should not be just a table of coordinates. An object identified on site can get its own ID, position, type, the attributes required by the project and an associated photo.
For roads we can also organise the information by chainage (kilometre post + metres) and by left or right side of the route.
So when the designer or the client opens the inventory later, they see not only that there is a sign at a given point, but also what it looked like at the time of capture and what was around it.
We can prepare the data as:
Layers per object class, in Stereo 70.
Layers per category, following the required structure.
Summaries by type, street or kilometre; coordinate list.
The image associated with each object.
Depending on the job, chainage, side of the route, summaries for supports or guardrails and any other fields requested by the client can be included. If the designer needs a working field such as “keep / replace”, it can be added to the database structure to be filled in during design.
3D Discovery documents the existing situation and organises the data. Decisions on keeping, replacing or the design solution belong to the specialists responsible for the project.
For visual inventory we use georeferenced panoramic capture. The Mosaic X system lets us drive routes and keep the image of the street as it was at the time of the campaign.
Positions from 360° imagery inventory are in the order of 1–2 metres. For many inventory and visual checking applications, that is enough.
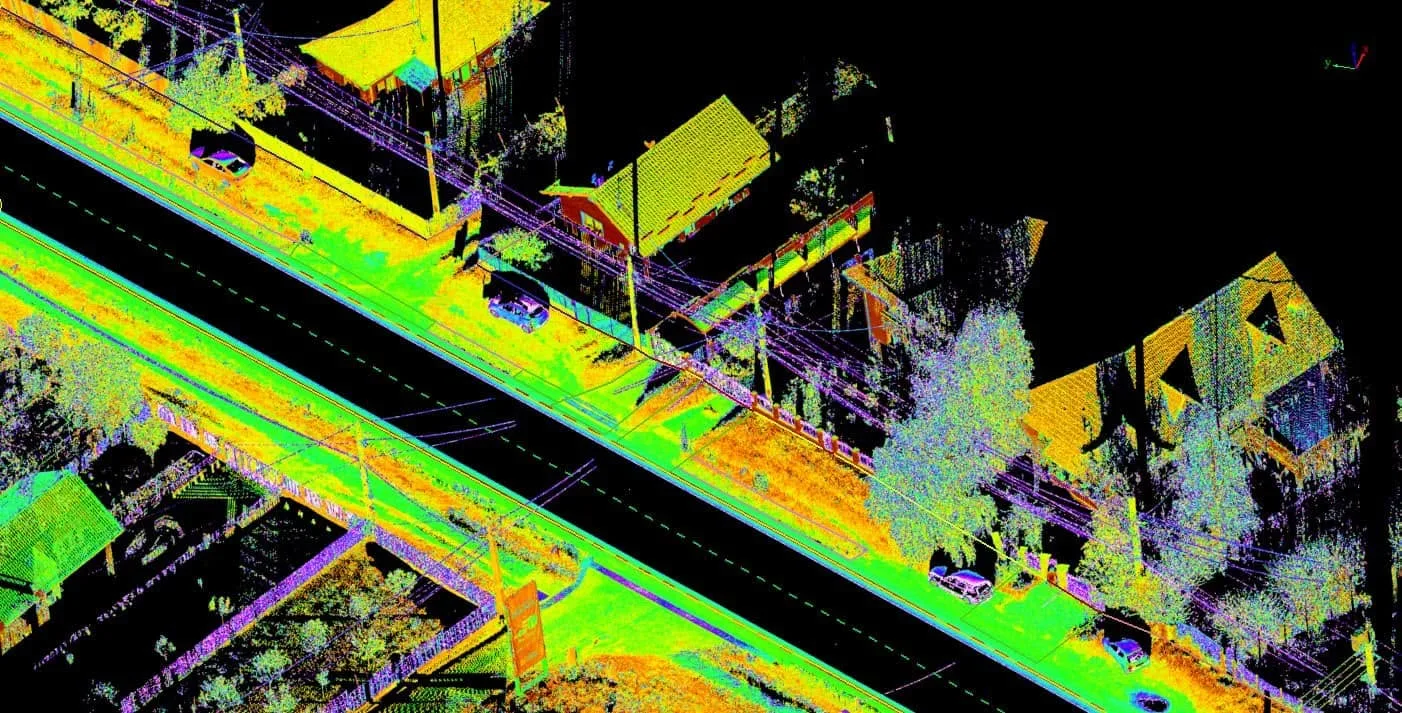
When the project needs survey-grade positions, measured geometry or data for documentation where accuracy is critical, we add LiDAR mobile mapping, terrestrial scanning and/or surveying.
We state the difference from the start, because we do not want to present a panoramic image as a topographic survey.
Was the sign before or after the junction?
Was the pole on the pavement or on the verge?
What else was next to the manhole?
What did the guardrail look like?
With a classic inventory, the answer can mean another site visit. If objects are linked to the 360° capture, some of these checks can be done from the office.
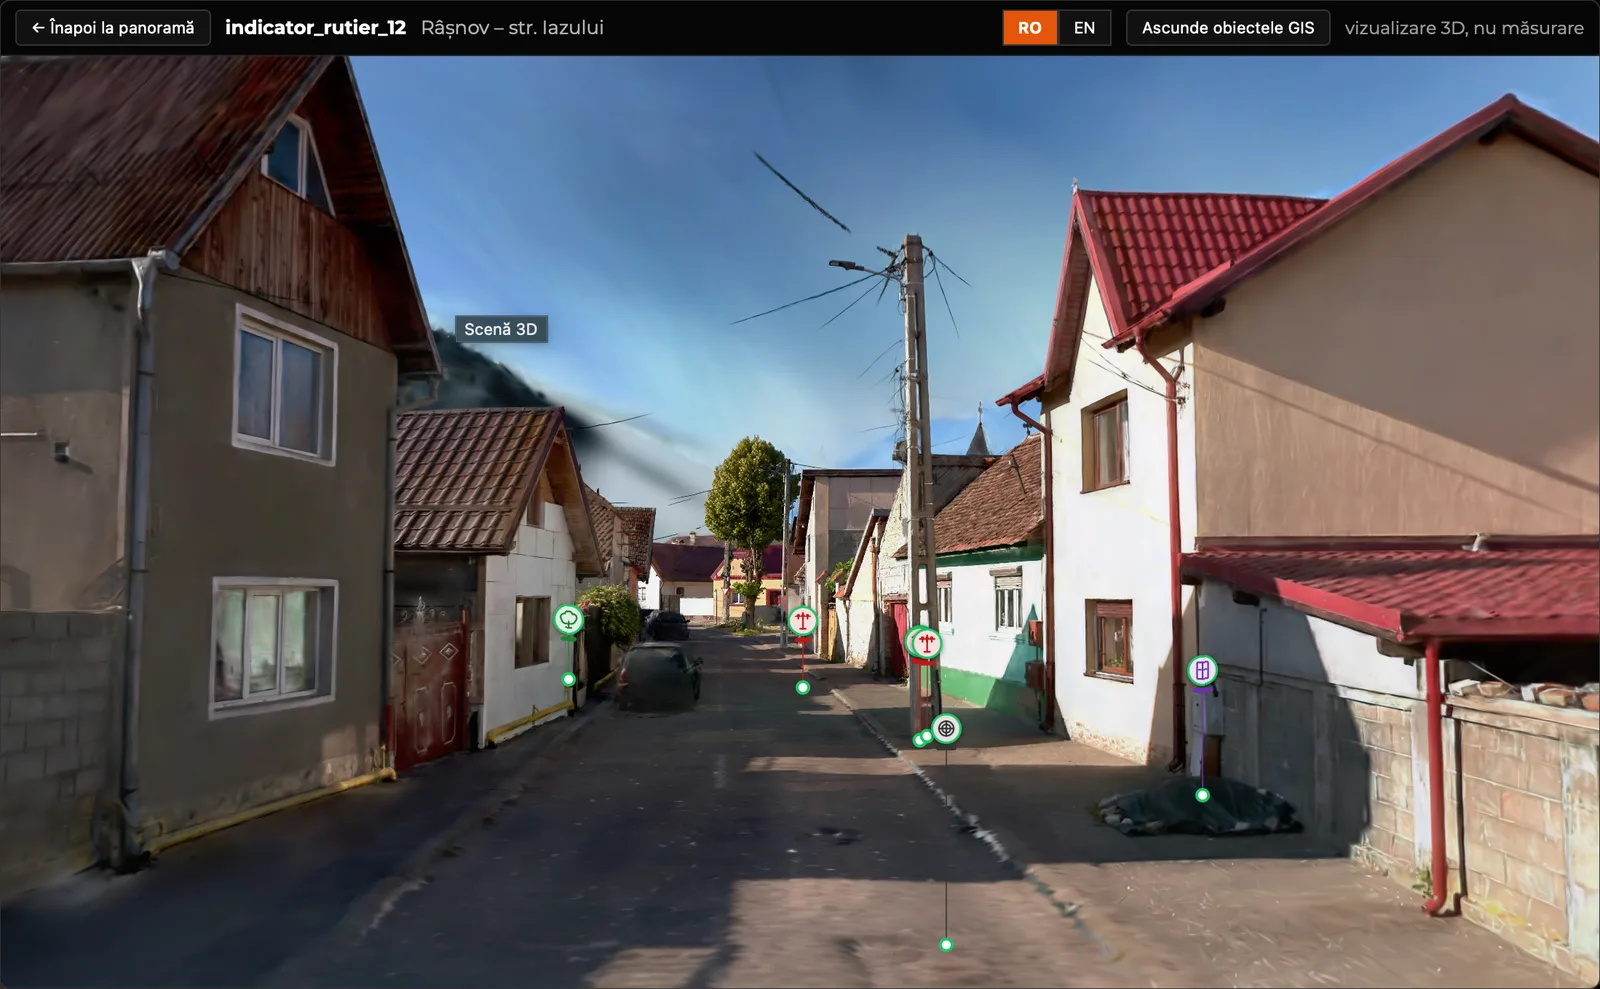
This is where 3DD Spatial Reality™ comes in. The inventory stays in GIS, and the platform offers a visual way to go back along the captured route and see objects in their real context.
A table or a shapefile shows where objects are. Field imagery adds context: you can check a sign, an access, a guardrail or a street frontage before deciding whether another visit is needed.
On projects with LiDAR, the inventory can be matched with the measured geometry of the route. 3D Discovery does not design or choose the technical solution; we deliver the existing situation in a form the designer can use.
A route captured for a road inventory can also include poles, trees, manholes or other public assets, if they are part of the brief from the start.
The point is not to merge all records into one, but that one field campaign can feed several databases, so no department starts from scratch.
The inventory is built around the objects that matter for the network: poles, manholes, cabinets, hydrants or other visible elements required by the project.
The 360° capture keeps the context of each site; where measured geometry is needed, we add LiDAR and surveying. Data is delivered for the client’s GIS and can be viewed visually in 3DD Spatial Reality™.
We have worked with GIS data and inventories in Horezu and Călimănești, including green spaces and the general urban plan.
See also: LiDAR mobile mapping · infrastructure projects.
The GIS files remain the technical deliverable. But the information is much easier to check if you also keep the image of the place it came from.
With 3DD Spatial Reality™, the client goes back along the captured route in the browser, sees the inventoried objects and views the area without installing anything. The live demo is on the dedicated page.
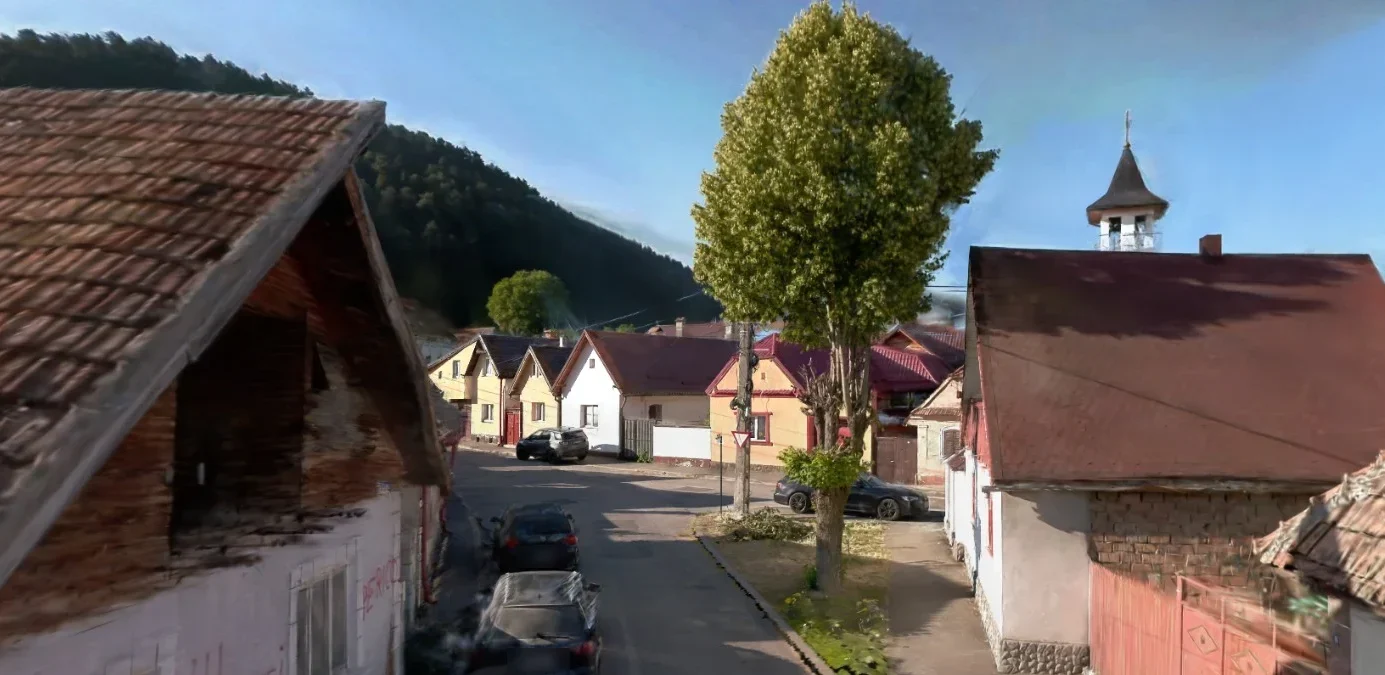
You do not need to know in advance whether the project needs panoramas, LiDAR or both. Just tell us the route, the approximate length, the objects to inventory and the required delivery format.
From there we agree the right capture method and the structure of the GIS database.