
Case study · Râmnicu Vâlcea, Romania · November 2026
Street condition and utility inventory, from the same vehicle capture.
We drove the northern district of Râmnicu Vâlcea with a vehicle carrying a 360° camera, in live traffic, with no closures. The result: pavement defects and utility assets on the street, each with a map position and a photo, each point reviewed and confirmed by our operators.
01 · The problem
You know the street is bad. You don’t know exactly where, how much, or what lies under it.
Municipalities, road authorities and utility operators work from old or incomplete records: a manhole cover missing from the plan, a valve nobody can find during a leak, a pothole reported by residents but not the one next to it. Inspection on foot is slow and depends on who does it. A full topographic survey is accurate, but too expensive just to keep a district’s records current.
Municipalities and road authorities
Where the defects are, on which section, what repair they need. A basis for the maintenance programme and for accepting finished works.
Water, sewer and gas
Manhole covers, gully inlets, valves, service connections: position, photo, visible condition. Records kept current without crews on foot.
Power and telecom
The same capture holds the poles, street cabinets and equipment along the route. For operators we propose a partnership: we define together what gets inventoried and how it is delivered. See below
02 · What we did
360° capture in traffic, review in the office
Capture
5 vehicle passes through the northern district: Calea lui Traian, Republicii, Daniil Ionescu, Sf. Calinic and the streets between them.
Alignment
All 8,254 images positioned together in a single coordinate system.
Identification
Defects and utility assets flagged on the images, then reviewed by an operator, point by point.
Delivery
Map with a photo on every point, GIS list, uninspected areas marked.
What the client receives
- Condition map in 10 m sections: good, fair, poor.
- Defect list: class, position, photo.
- Utility asset inventory on the carriageway: manhole covers, gully inlets, valves.
- Uninspected areas, marked on the map. We don’t hide what we didn’t see.
03 · The map
Click a point to see the photo
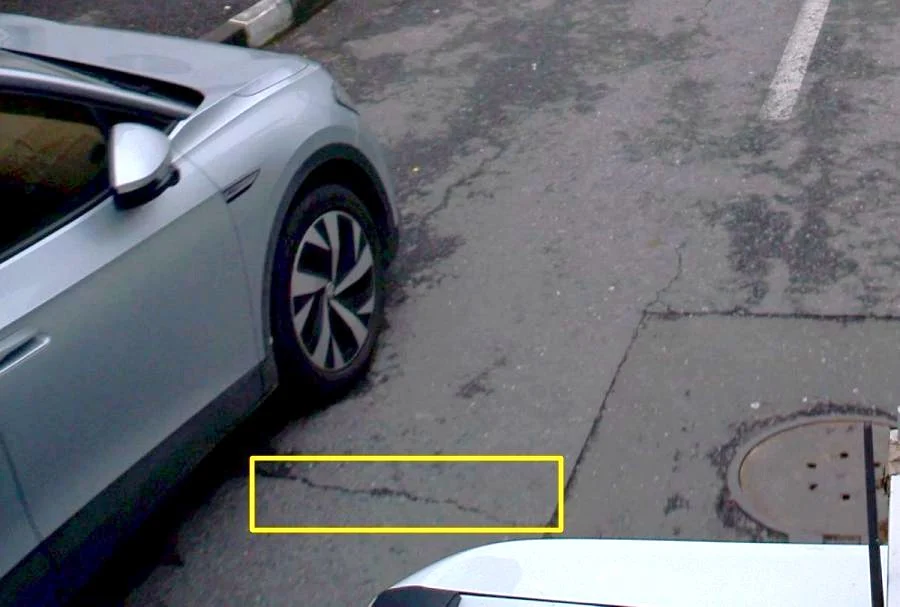
Every defect on the map has its own photo with the area outlined. People and vehicles are anonymised. Map labels are in Romanian.
04 · The numbers
What we measured
| Defect class | On the map | Confirmed at operator review |
|---|---|---|
| Longitudinal cracks | 154 | 96% |
| Transverse cracks | 78 | 95% |
| Alligator cracking | 45 | 88% |
| Potholes | 18 | only operator-confirmed ones on the map |
The percentages show how much of what processing flagged the operator confirmed. Only confirmed points stay on the map, plus 11 manhole covers and 10 patches, kept apart from defects. Images that failed the anonymisation check were removed. How many defects were missed we have not measured and do not claim.
| Utility assets on the carriageway | Confirmed by an operator |
|---|---|
| Manhole covers | 164 (plus 6 with uncertain position) |
| Gully inlets | 16 |
| Valves | 6 |
05 · Stated limits
What this study does not show
- Nothing is visible under parked cars. Those areas appear on the map as uninspected.
- Very fine cracks depend on light and speed.
- Asset positions from imagery are indicative, in the order of 1–2 m: fit for records and planning, not for design.
- The result is a condition survey, not a structural assessment.
When you need more: LiDAR and survey
For design, permits or levels, the same street is measured with LiDAR and topographic survey, with the method agreed before fieldwork. The 360° imagery stays as the records and visual-check layer. This study used panoramic capture only.
06 · Power and telecom
The Vâlcea study is an example. For networks, we build it together with the operator.
Here we showed what comes out on the carriageway. The same 360° capture also holds the poles, street cabinets, distribution boxes and pole-mounted equipment. Which classes matter, what they are called in your records and how they enter your GIS, we agree with the operator before fieldwork.
How we propose to work
- A pilot section chosen by you, in an area where you already know what exists.
- Classes and attributes from your own records, not a generic list.
- Joint check: we compare the result with what you know, point by point.
- Delivery in the GIS format you use, with a photo on every asset.
- Where design needs levels or geometry, we add LiDAR and topographic survey.
The pilot as an acceptance test
You pick one asset class (poles, for example) and send us your attribute schema. The pilot is accepted if your GIS lead:
- imports the file into your system with no manual conversion;
- sees, for every asset, the source of its position (360° image or topographic / LiDAR survey);
- opens the asset photo by its ID.
Have a street, a district or a network to put on the map?
Tell us the route and what the records must contain. We reply within 24 business hours.